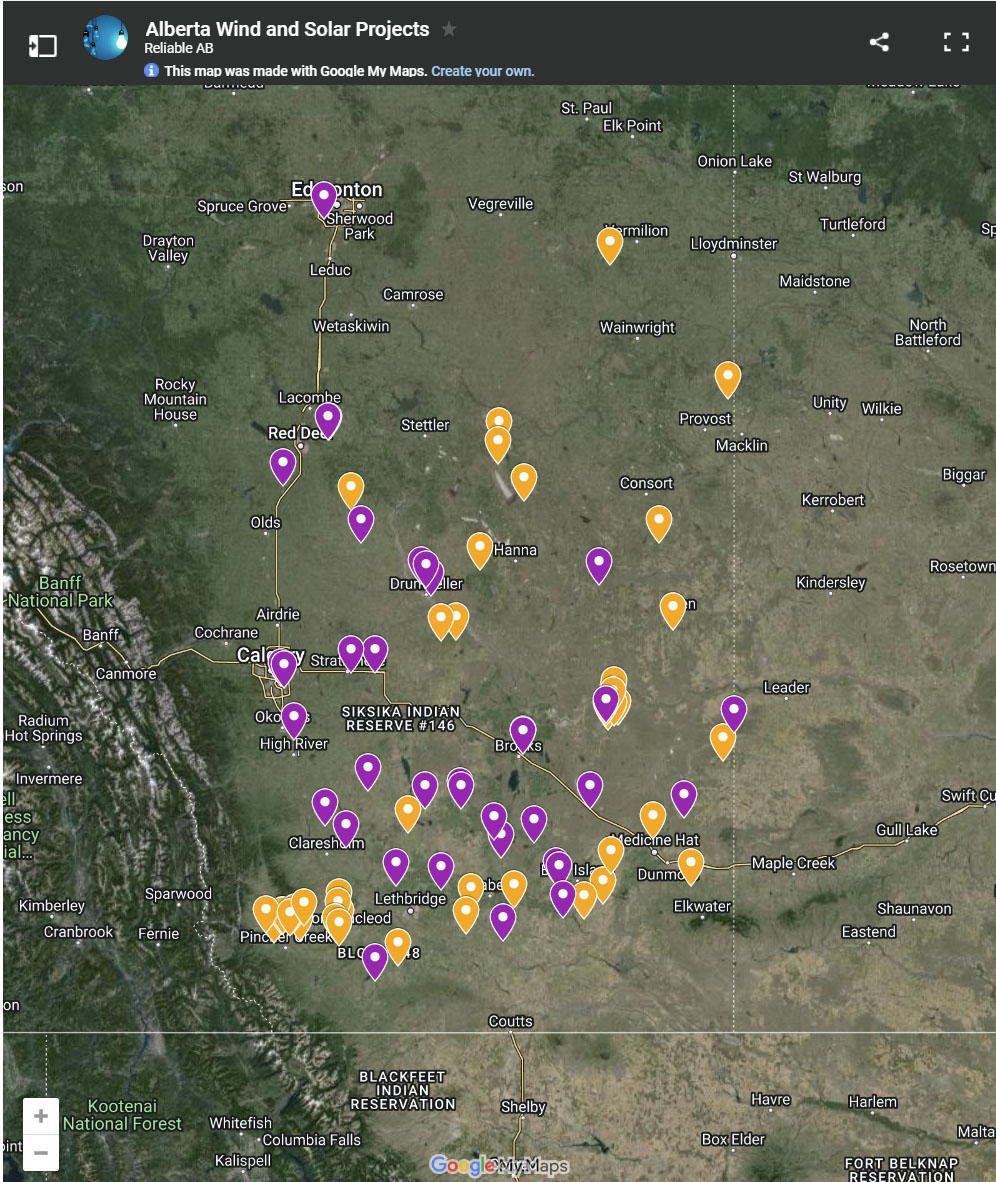
Orange pins are the approximate centre of Alberta’s grid-scale wind faculties, purple are grid-scale solar facilities. The map was prepared by @ReliableAB
How much power can you really get out of photovoltaic solar in the middle of winter?
Not much, if data from the Alberta Electric System Operator (AESO) has anything to say about it.
Sunday, Dec. 31 was the shortest day of the year. And at noon, Alberta’s total solar fleet was producing 612 megawatts out of a cumulative nameplate rating of 1,850 megawatts for its 47 grid-scale solar farms.
That’s 33 per cent output, at noon, when the sun is highest in the sky.
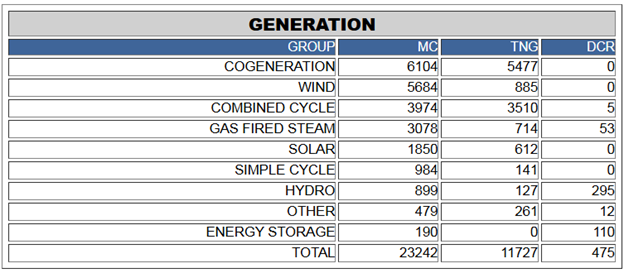
MC is maximum capacity, in megawatts. TNG is total net to grid. DCR is dispatched, and accepted, contingency reserve. This was at 12 noon on Sunday, Dec. 21, 2025. AESO
Digging deeper
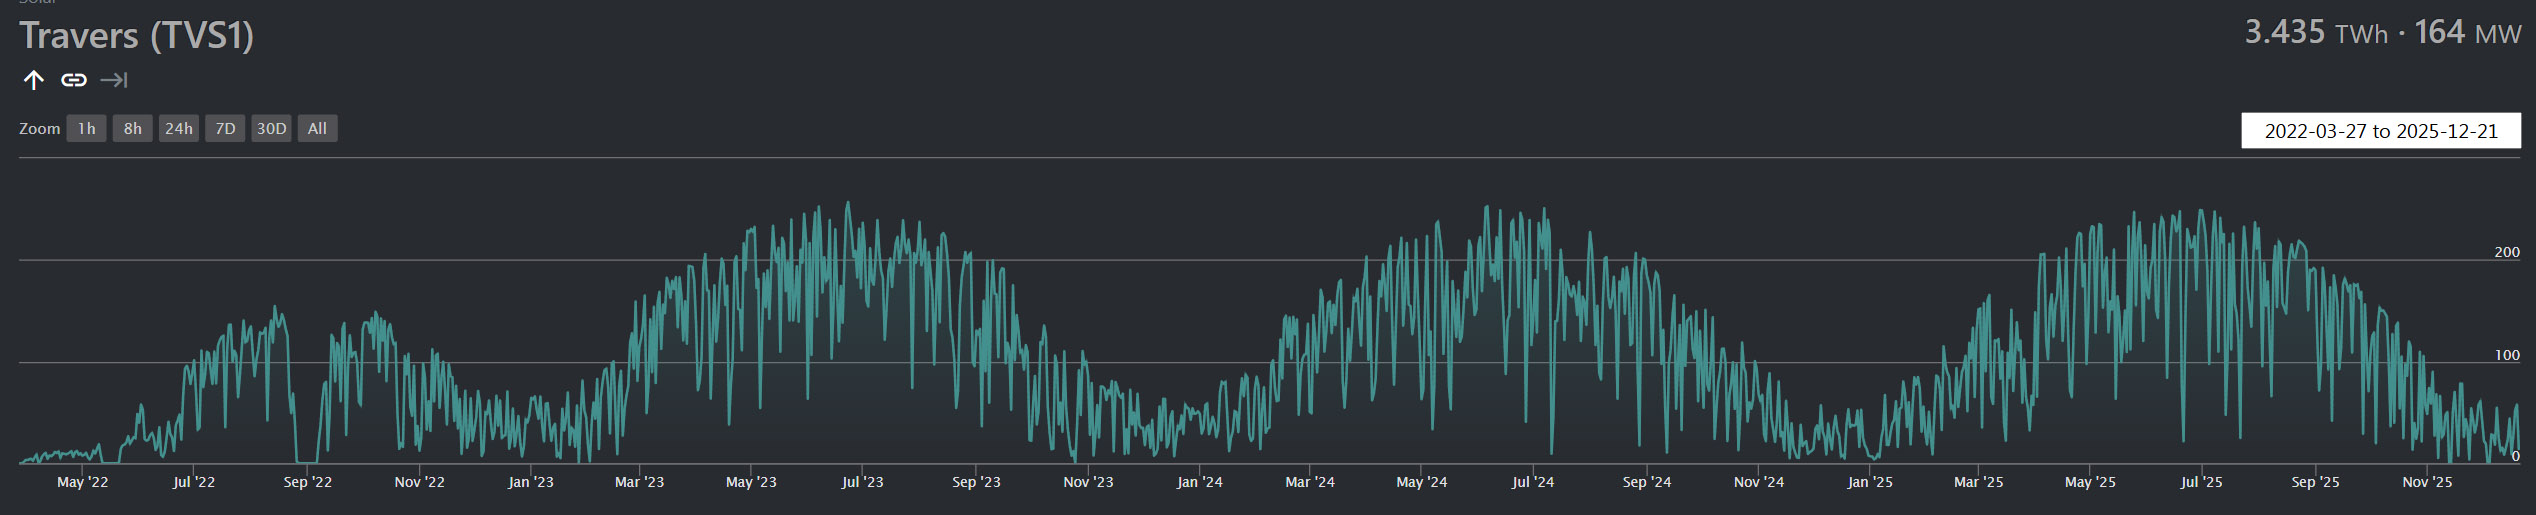
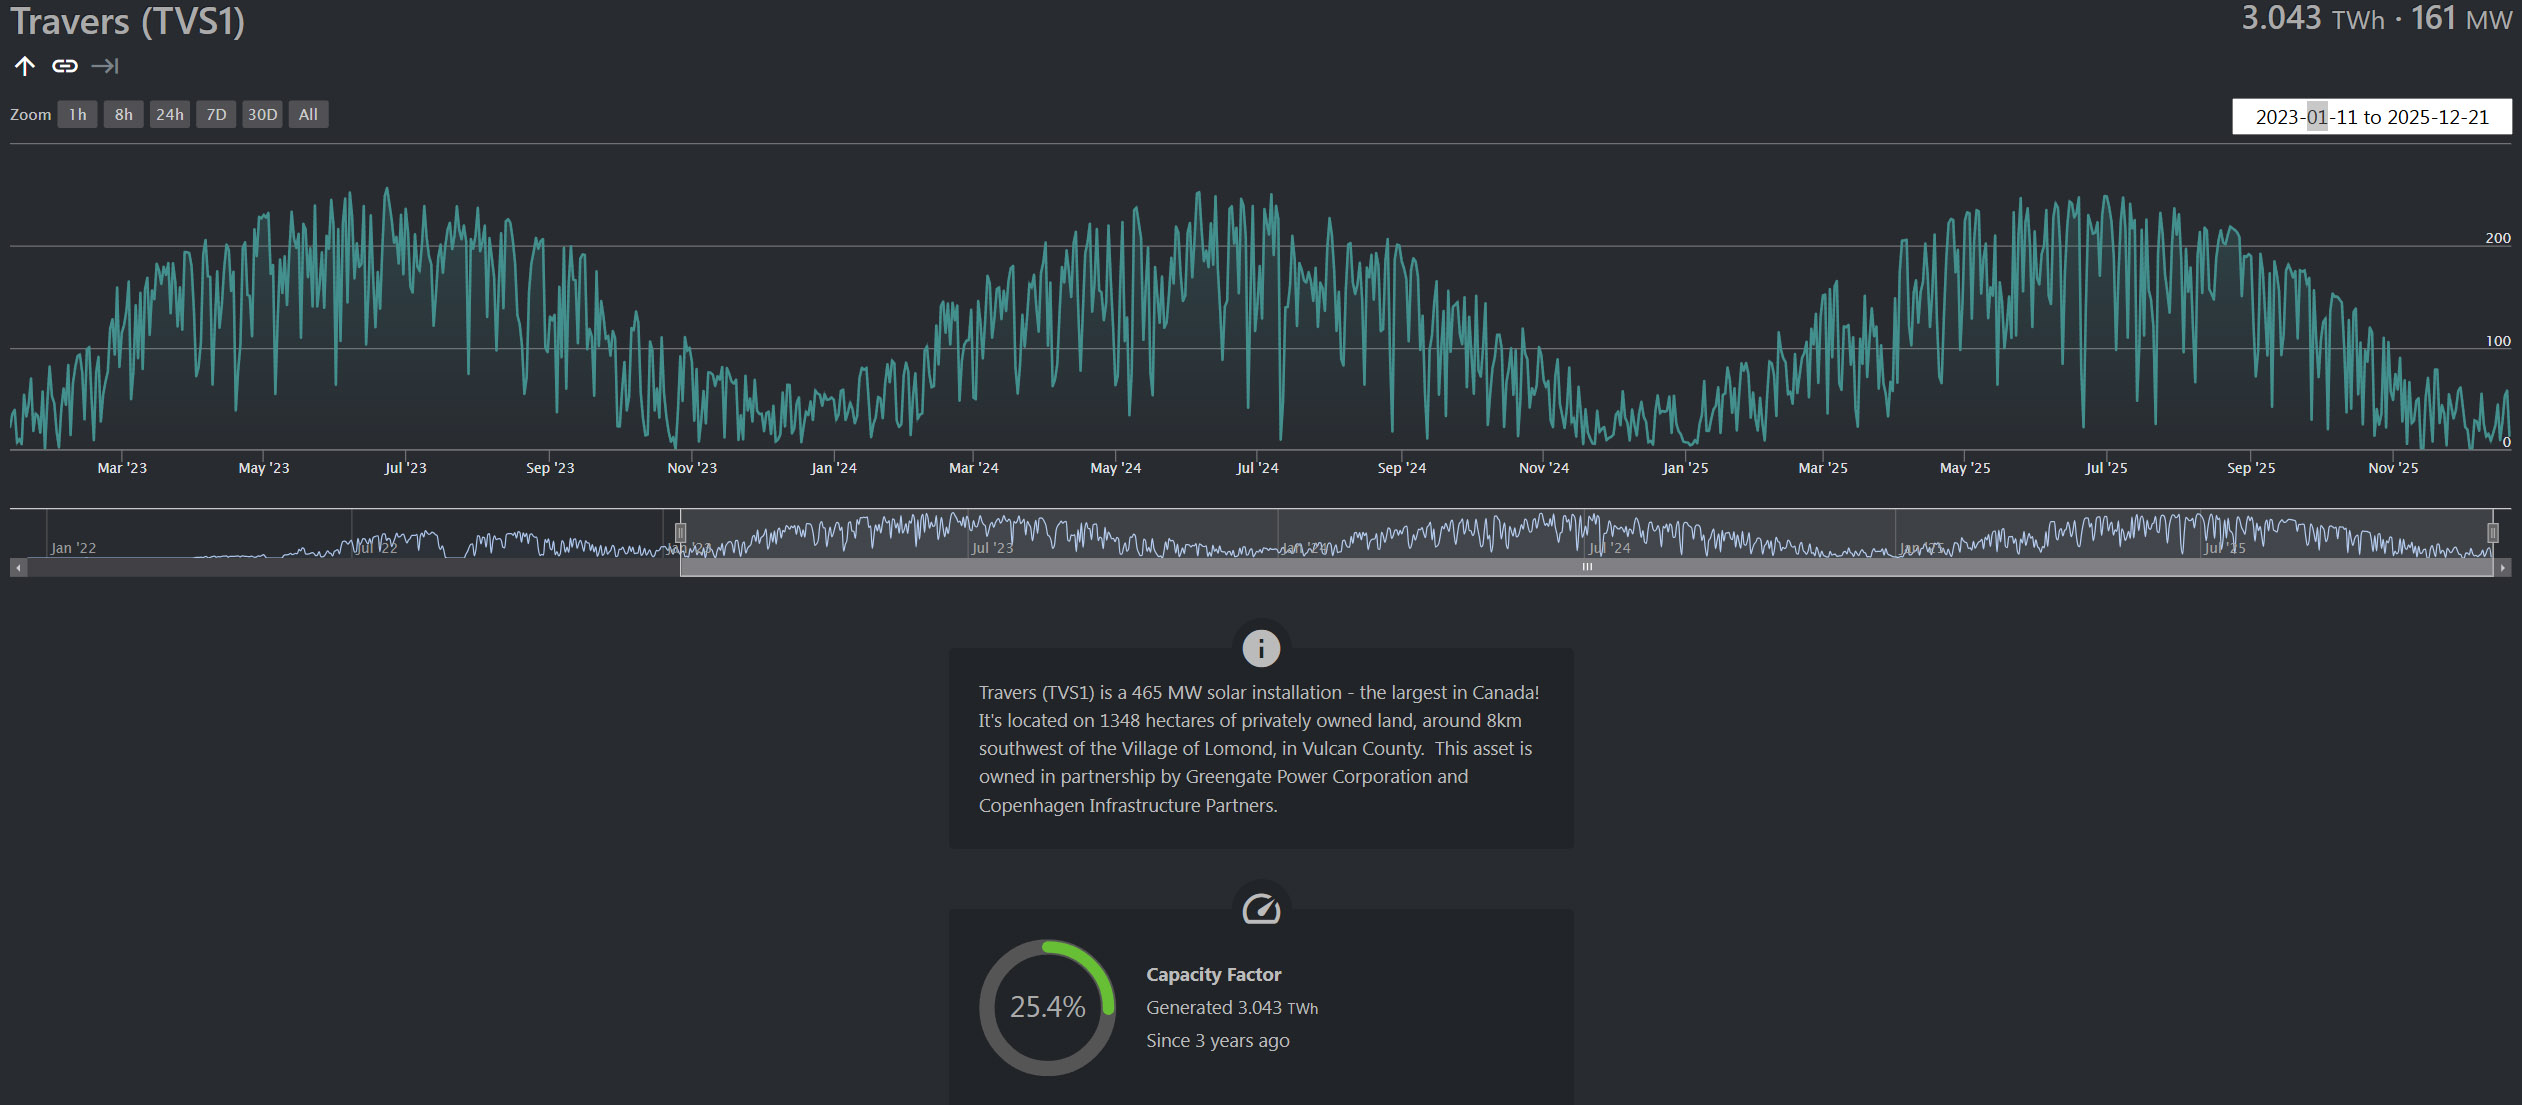
A good metric to follow is the Travers solar facility in Vulcan County. It’s the largest solar plant in Canada, and only a few years old, so it’s presumably the latest in technology. Its nameplate capacity is 465 megawatts, but in the summertime, it routinely puts out 466 megawatts. And if it’s a sunny day, it will put out that 466 for much of the day. On May 28, 2025, Travers produced a full 466 megawatts for 10 hours and 41 minutes without flag or fail, from 7:54 a.m. to 6:35 p.m., not counting the morning ramp up or evening ramp down. In total, on that day, Travers produced 53.1 per cent of its capacity factor. Three weeks before the summer solstice, that’s about as perfect as a day as Travers gets.
But come winter, it’s a different story entirely.
Website Dispatcho.app logs the minute-by-minute data supplied by the AESO, including individual pages for every grid-scale power generator on the Alberta grid.
Here’s the maximum output for each of the last seven days from Travers:
- 14: 103.8 megawatts
- 15: 262.8 megawatts
- 16: 249.6 megawatts
- 17: 82.0 megawatts
- 18: 331.1 megawatts
- 19: 280.6 megawatts
- 20: 288.6 megawatts
- 21: 186.0 megawatts at peak, 135 megawatts at noon
You can see for yourself at this link.
Notably, there were several Alberta Clipper storms that affected southern Alberta during this week, which likely had an impact on solar output as snow and associated cloud would not only cover panels, but mask much of the sunlight from reaching the ground in the first place. The 82 megawatt peak on Dec. 17 was only 17 per cent of maximum capacity for the facility – and that was the peak. And at 1:18 p.m., when the sun was close to the highest in the sky, output was just 9 megawatts out of 466.
According to Dispatcho.app, Travers’ capacity factor for the 30 days leading up to Dec. 21 was just 6.3 per cent. That’s a capacity factor of just 1/16th of nameplate, for an entire month.
This is what Travers’ output looks like for the last four years, since it went online. The peaks are summer output, and the valleys are winter output. When looking at an individual day in the winter, the graph resets the vertical scale to fill the graph. This is a more representative example. It indicates that solar output craters for November and December and starts to pick up mid-January. That’s roughly two months of minimal output for each of the last three years of late fall/early winter.
Dispatcho.app
It took a while for Travers to reach full capacity of 466 megawatts. Since it has reached full capacity, for three full years, Traver’s total capacity factor was 25 per cent.
Dispatcho.app
The reality is both of these graphs don’t have the fidelity to show the true story. While it does show the daily peaks, because so much data is crammed into the timeline, it does not show the daily minimuns, which is zero, every single day. If the graph were to do that, it would show bascically a scribbled in area under the curve showing daily peaks and minimums as it zeroed out each day.
Importance
So why is this important? The federal Clean Electricity Regulations seek to eliminate fossil fuel-fired power generation in Canada in the coming years. The federal government has bene heavily pushing provinces like Alberta and Saskatchewan to build wind and solar power generation capacity, and federal coal regulations mean to shut down coal fired power generation in four years and 10 days. But Alberta recently signed a Memorandum of Understanding with the federal government which will exempt that province from the Clean Electricity Regulations. In turn, Alberta will not only continue to have an industrial carbon tax, but will increase it to $130 per tonne as of April 1, 2026.
Under a 2018 coal equivalency agreement between Saskatchewan and the federal government, this province agreed to add 3,000 megawatts of wind and solar by 2035, in exchange for allowing Boundary Dam Units 4 and 5 to operate a few more years. Those years have now elapsed, and Unit 4 was retired, supposedly for good, and disconnected from the grid a year ago. In June the Saskatchewan Party government announced it would not be shutting down the coal fleet, and instead be spending $900 million to refurbish its coal-fired power generation fleet, starting with Boundary Dam Unit 4. That 150 megawatt unit is expected to be back online early in the new year.
The Canada-Alberta MOU does not directly apply to Saskatchewan. As of now, Saskatchewan is still subject to the Clean Electricity Regulations, and the coal regulations, both of which the province has announced its intentions to ignore.
This year saw the announcement of an additional privately-held 200 megawatt wind facility near Assiniboia and 100 megawatt solar facility adjacent the Poplar River Power Station at Coronach. Enbridge and its partners are still in the decision making process to go ahead with its 200 megawatt wind project at Weyburn known as Seven Stars. But after those projects, there doesn’t seem to be much more in the pipeline for large-scale Saskatchewan wind and solar development for the foreseeable future.
So whether or not Saskatchewan continues to pursue filling out that 3000 megawatt wind and solar commitment, or whether it will reach a deal with the federal government on the Clean Electricity Regulations and the coal regulations remains to be seen.